

- Market Size (2026)
- USD 36.8 Bn
- Forecast (2036)
- USD 57.1 Bn
- CAGR (2026 to 2036)
- 4.5%
Prophylactic HIV Drugs Market Size, Market Forecast and Outlook By FMI
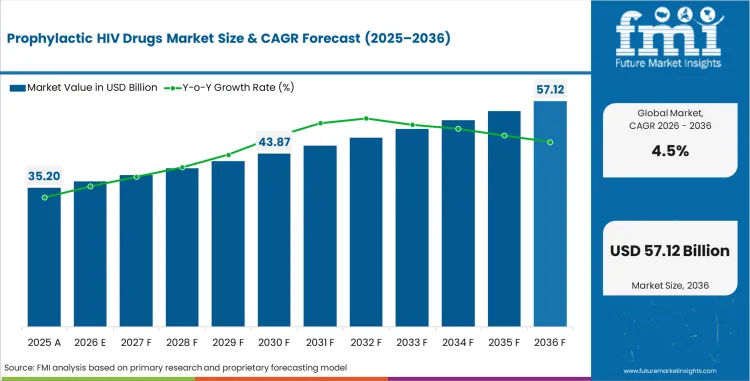
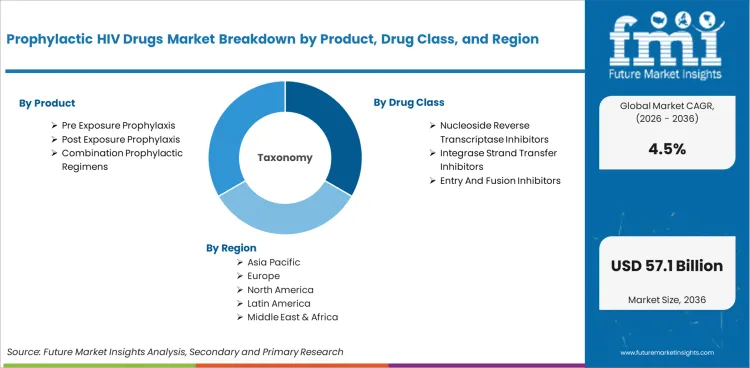
The prophylactic hiv drugs market was valued at USD 35.2 billion in 2025. The market is set to reach USD 36.8 billion by 2026-end and grow at a CAGR of 4.5% between 2026-2036 to reach USD 57.1 billion by 2036. Pre Exposure Prophylaxis will dominate with a 60.0% share, while Nucleoside Reverse Transcriptase Inhibitors will lead with a 50.0% share.
Summary of the Prophylactic HIV Drugs Market
- Demand and Growth Drivers
- Pre-exposure prophylaxis accounts for 65.0% of application demand, reflecting the growing adoption of PrEP as a primary HIV prevention strategy recommended by WHO and national health authorities for high-risk populations.
- NRTIs account for 50.0% of drug class demand, with tenofovir-based regimens forming the backbone of current PrEP and PEP treatment protocols.
- Hospital pharmacies account for 60.0% of distribution, reflecting the clinical initiation model where PrEP programs are managed through hospital and clinic-based prescribing.
- Product and Segment View
- Pre-exposure prophylaxis products are expected to be the key drivers of product demand, accounting for 60.0% of demand, as the structural shift to prevention-led HIV strategies from treatment-only approaches continues.
- NRTIs account for 50.0% of demand for drug classes, with tenofovir disoproxil fumarate and tenofovir alafenamide serving as cornerstone molecules in prophylactic regimens.
- 60.0% of therapy type demand is for continuous therapy but long-acting injectable formulations are gaining share as they improve adherence.
- Geography and Competitive Outlook
- China (6.08%) leads global growth, supported by government HIV prevention program expansion and growing PrEP awareness.
- North America sustains the largest market value through established PrEP programs and premium-priced branded formulations.
- Gilead Sciences (35.0%) dominates through Truvada and Descovy PrEP franchises and patent-protected formulations.
- Analyst Opinion
- Sabyasachi Ghosh, Principal Consultant at FMI says, 'The transition to long-acting injectable PrEP formulations represents the most significant structural shift in the prophylactic HIV market, as improved adherence outcomes are likely to expand the eligible population and improve prevention program effectiveness.'
- The prophylactic HIV drugs market is transitioning from daily oral regimens to long-acting injectable and implantable formulations that address the adherence challenges limiting daily PrEP effectiveness.
- Generic competition following patent expiries is restructuring market economics, reducing per-patient costs in emerging markets while compressing branded margins in mature markets.
- Government-funded prevention programs in Sub-Saharan Africa, South Asia, and East Asia represent the largest volume growth opportunity.
Key Takeaways, Market Size, and Forecast
- The prophylactic hiv drugs market was valued at USD 35.20 billion in 2025.
- By 2036, the Prophylactic HIV Drugs Market is expected to be worth USD 57.12 billion.
- From 2026 to 2036, the market is projected to expand at a CAGR of 4.5%.
- The market is projected to create an incremental opportunity of USD 20.34 billion between 2026 and 2036.
- In 2026, nucleoside reverse transcriptase inhibitors is expected to account for 50% of the drug class segment, driven by the critical role of pre-exposure prophylaxis in reducing HIV transmission rates among high-risk populations.
- China (6.08%) and India (5.62%) are two of the fastest growing markets in the world.
Prophylactic HIV Drugs Market Definition
The prophylactic HIV drugs market includes antiretroviral medications used for pre-exposure prophylaxis (PrEP), post-exposure prophylaxis (PEP), and maternal transmission prevention. Products include nucleoside reverse transcriptase inhibitors, integrase strand transfer inhibitors, and entry and fusion inhibitors in oral, injectable, and combination formulations.
Prophylactic HIV Drugs Market Inclusions
Market scope encompasses all commercially traded prophylactic HIV drugs categorized by product (PrEP, PEP, combination regimens), drug class (NRTIs, integrase inhibitors, entry and fusion inhibitors), application (pre-exposure prophylaxis, post-exposure prophylaxis, maternal prophylaxis), end use (hospitals, clinics, NGOs, home care), distribution channel (hospital pharmacies, retail pharmacies, online pharmacies, government supply), and therapy type (continuous, long-acting, emergency). Revenue estimates cover the period from 2026 to 2036.
Prophylactic HIV Drugs Market Exclusions
The scope does not include antiretroviral drugs used exclusively for HIV treatment in diagnosed patients, HIV vaccines under development, or diagnostic testing products.
Prophylactic HIV Drugs Market Research Methodology
- Primary Research FMI interviewed infectious disease experts, HIV prevention program managers, generic pharmaceutical manufacturers and procurement officials of public health programs in key markets.
- Desk research: Data was collected from WHO HIV prevention guidelines, national PrEP program enrolment data, pharmaceutical regulatory databases and antiretroviral drug market tracking.
- Market sizing and forecasting: Bottom-up aggregation of PrEP enrollment, PEP utilization, and maternal prophylaxis coverage rates, with adjustments for regional access expansion.
- Data Validation: Quarterly cross-checked with pharmaceutical sales tracking data, government procurement records and manufacturer revenue disclosures.
Why is the Prophylactic HIV Drugs Market Growing?
- National program expansion is driven by WHO recommendation of PrEP for high-risk populations, establishing structured procurement pipelines through government health systems.
- Long-acting injectable PrEP formulations are addressing the adherence challenge of daily dosing that limits the effectiveness of oral PrEP and potentially broadening the eligible and willing population.
The prophylactic HIV drugs market is projected to reach USD 36.78 billion by 2026 from an estimated USD 57.12 billion in 2036, at a CAGR of 4.5%. Demand was driven by the expansion of the PrEP program, government funding for prevention, and the move to long-acting formulations. Demand for PrEP products accounts for 60.0%.
Gilead Sciences leads with 35.0% share, fueled by the Truvada and Descovy PrEP franchises. Patent protection for tenofovir alafenamide-based formulations maintains premium pricing in mature markets and generic tenofovir disoproxil fumarate is used in government programs in emerging markets.
China leads at 6.08% CAGR, boosted by expansion of government programs for prevention. India has a 5.62% CAGR from generic manufacturing capacity and government procurement programs
Market Segmentation Analysis
- The product share of PrEP is 60.0% which shows the shift in structure to prevention-led HIV strategies rather than treatment-only strategies in global health policy.
- Pre-exposure prophylaxis applications account for 65.0% of demand, with the main prevention pathway being daily oral and emerging long-acting injectable regimens.
- Distribution by hospital pharmacies represents 60.0%, which is consistent with the initiation and monitoring of the PrEP program from a clinical perspective.
The prophylactic HIV drugs market is segmented on the basis of product, drug class, application, end use, distribution channel, and therapy type. Demand patterns are driven by government funding of prevention programmes, the adoption of clinical guidelines and policies of access to pharmaceuticals.
Insights into the Pre-Exposure Prophylaxis Application Segment
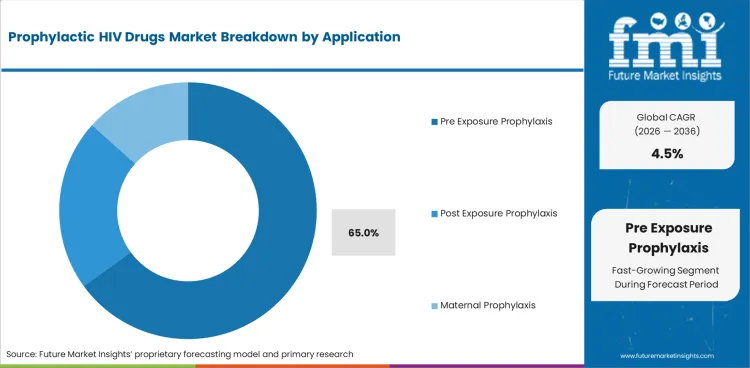
PrEP is expected to hold 65.0% share of the application segment in 2026. Oral regimens based on tenofovir are still the standard of care on a daily basis, while long-acting injectable cabotegravir is taking hold as a way to overcome adherence issues.
The second largest use is postexposure prophylaxis. Emergency antiretroviral regimens are prescribed following possible exposure to HIV in health care and community settings.
Insights into the NRTI Drug Class Segment
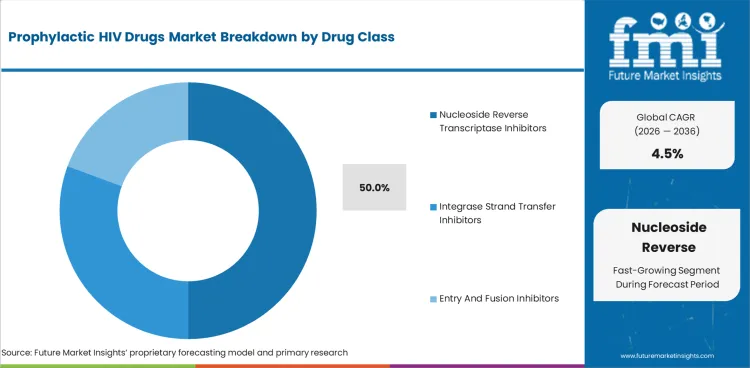
NRTIs (50.0%) accounts for the demand for drug class. Current PrEP regimens are based on tenofovir disoproxil fumarate and tenofovir alafenamide with emtricitabine as the standard combination partner.
Integrase strand transfer inhibitors are gaining share with two-monthly cabotegravir long-acting injectable PrEP as an alternative to daily oral regimens.
Prophylactic HIV Drugs Market Drivers, Restraints, and Opportunities
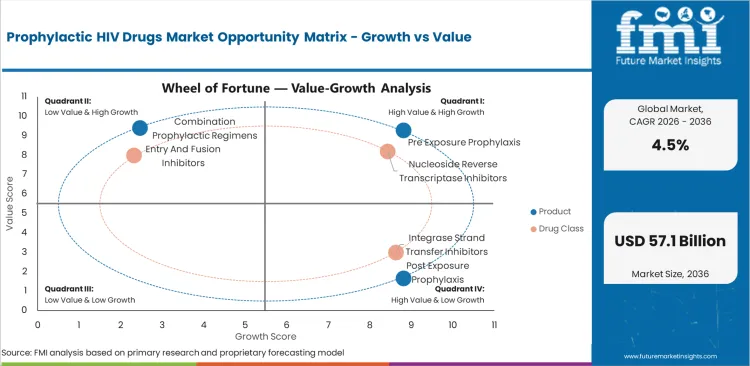
- Expansion of government-funded PrEP programs creates structured procurement pipelines that provide demand visibility to manufacturers.
- Tenofovir-based formulations have lost patent protection, allowing generics to compete and reduce per-patient costs but crimp branded margins.
- The most important product innovation is the long-acting injectable formulations which improves adherence and increases the eligible population.
The market is affected by government prevention programs, the patent landscape and generic competition, and the development of long acting formulations to overcome adherence challenges.
Government Prevention Program Expansion
WHO recommendations and national health authority guidance are driving the increase in PrEP program enrollment. Government procurement provides structured demand pipelines with predictable volumes, particularly for programs funded by PEPFAR, the Global Fund and national health budgets.
Patent Dynamics and Generic Competition
Tenofovir disoproxil fumarate is no longer under patent, thus generic manufacturers in India are able to supply government programs at substantially lower prices. Gilead’s premium pricing in mature markets is supported by patents for tenofovir alafenamide.
Long-Acting Injectable PrEP Transition
Cabotegravir long-acting injectable PrEP is dosed every two months, resolving adherence issues with daily oral regimens. Clinical trial data suggest daily oral PrEP is more effective than other methods for preventing HIV infection, which supports the expansion of PrEP uptake.
Maternal Prophylaxis Programs
Prevention of mother-to-child transmission programs form a separate demand segment of high public health priority. Government and NGOs funding maternal prophylaxis adds to the volume of procurement.
Analysis of Prophylactic HIV Drugs Market By Key Countries
.webp "Top Country Growth Comparison Prophylactic Hiv Drugs Market Cagr (2026 2036)")
| Country | CAGR |
|---|---|
| China | 6.08% |
| India | 5.62% |
| Germany | 5.18% |
| Brazil | 4.72% |
| USA | 4.28% |
| UK | 3.82% |
| Japan | 3.38% |
Source: FMI analysis based on primary research and proprietary forecasting model
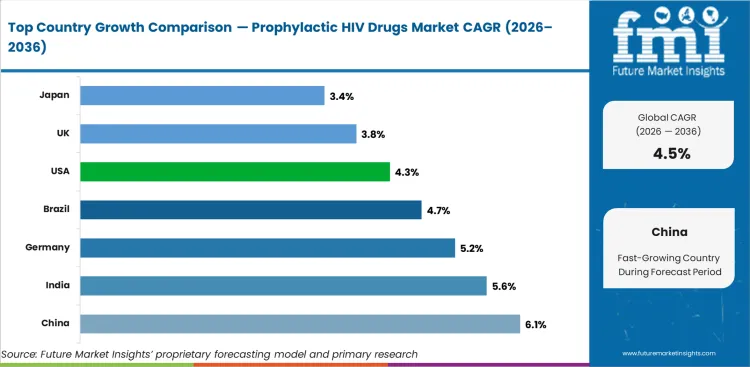
- The country with the highest CAGR of 6.08% is China, driven by the expansion of government HIV prevention programs, increasing awareness of PrEP and the update of national treatment guidelines.
- 5.62% India, strong demand is supported by a large high-risk population, growing antiretroviral manufacturing capacity and government prevention programs.
Regional demand reflects government prevention program funding, pharmaceutical access policies, and PrEP program maturity. North America sustains the highest per-patient value, while Asia and Africa represent the largest volume growth opportunities.
Future Outlook for Prophylactic HIV Drugs Market in India
India is projected to grow at 5.62% CAGR through 2036. Generic antiretroviral manufacturing scale, government prevention programs, and expanding PrEP awareness create growth conditions.
- Generic pharmaceutical manufacturing capacity positions India as a global supplier of affordable PrEP medications.
- Government prevention programs through NACO are expanding PrEP access to high-risk populations.
- Indian generic manufacturers supply PrEP medications to PEPFAR and Global Fund procurement programs globally.
Opportunity Analysis of Prophylactic HIV Drugs Market in Germany
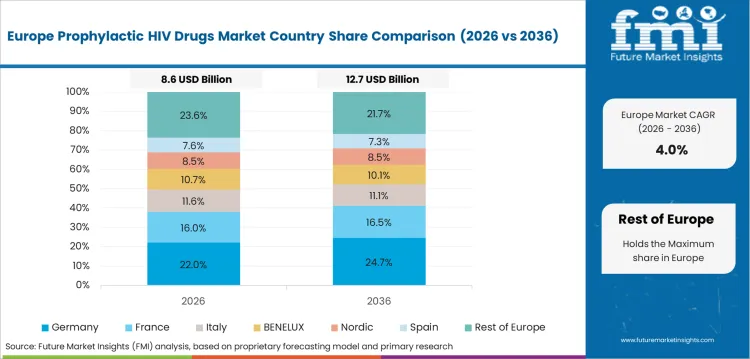
Germany is projected to grow at 5.18% CAGR through 2036. National PrEP program integration into healthcare system reimbursement and expanded eligibility drive demand.
- Healthcare system reimbursement for PrEP creates non-discretionary demand within the national prevention program.
- National HIV prevention strategy expansion is increasing PrEP awareness and prescribing rates.
- Generic tenofovir availability is reducing per-patient costs and supporting program enrollment expansion.
In-depth Analysis of Prophylactic HIV Drugs Market in Brazil
Brazil is projected to grow at 4.72% CAGR through 2036. The national PrEP program, one of the first in Latin America, sustains demand through government procurement.
- National PrEP program established through SUS provides free PrEP access to eligible populations.
- Government procurement of generic antiretrovirals sustains affordable program expansion.
- Community health programs are expanding PrEP awareness and access in underserved populations.
Sales Analysis of Prophylactic HIV Drugs Market in the United States
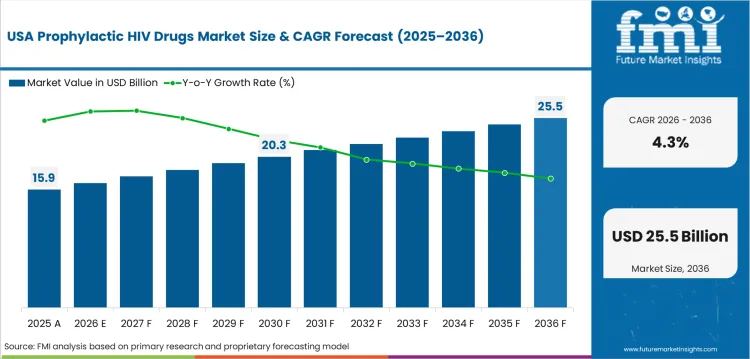
The USA is projected to grow at 4.28% CAGR through 2036. Established PrEP programs, expanded eligibility guidelines, and the transition to long-acting injectable formulations sustain demand.
- Expanded PrEP eligibility guidelines from CDC are increasing the addressable population for prophylactic treatment.
- Long-acting injectable cabotegravir adoption is improving adherence outcomes and expanding willing users.
- Insurance coverage mandates and government assistance programs are reducing financial barriers to PrEP access.
Growth Analysis of Prophylactic HIV Drugs Market in the United Kingdom
The UK is projected to grow at 3.82% CAGR through 2036. NHS PrEP program expansion and generic availability support demand.
- NHS PrEP program provides free access to eligible populations, sustaining enrollment growth.
- Generic tenofovir availability reduces NHS procurement costs and supports program expansion.
- Community outreach programs are expanding PrEP awareness beyond traditional clinical settings.
Market Landscape for Prophylactic HIV Drugs Market in Japan
Japan is projected to grow at 3.38% CAGR through 2036. Growing PrEP awareness, healthcare system integration, and clinical guideline updates support market development.
- PrEP awareness growth among healthcare providers and high-risk populations supports prescribing rate increases.
- Healthcare system integration of PrEP into HIV prevention guidelines creates structured demand.
- Japanese pharmaceutical companies are developing local supply capabilities for prophylactic antiretrovirals.
Competitive Landscape and Strategic Positioning
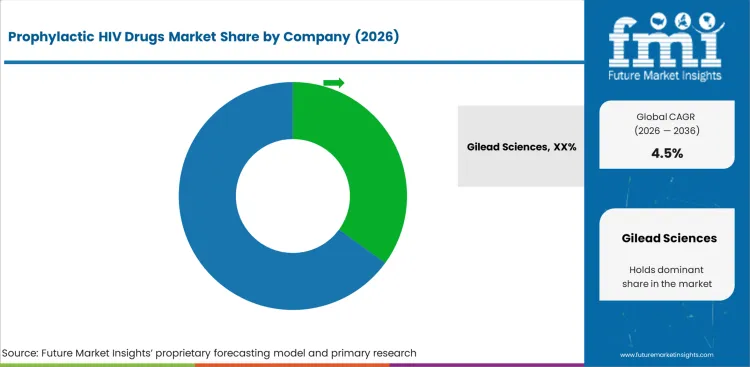
- Gilead Sciences (35.0%) dominates through Truvada and Descovy PrEP franchises, patent-protected formulations, and established prevention program partnerships.
- ViiV Healthcare competes through cabotegravir long-acting injectable PrEP, the primary product innovation disrupting daily oral regimen dominance.
- Indian generic manufacturers including Cipla and Mylan provide affordable tenofovir-based PrEP for government programs globally.
Key Companies in the Prophylactic HIV Drugs Market
Key global companies leading the prophylactic hiv drugs market include:
- Gilead Sciences, ViiV Healthcare, Merck & Co., Inc. maintain leading positions through established manufacturing infrastructure, distribution networks, and product breadth.
- Johnson & Johnson, Cipla Limited hold strong regional or segment-specific positions with specialized capabilities.
- Mylan N.V., Teva Pharmaceutical Industries Ltd., Hetero Healthcare represent emerging players expanding through technology innovation and niche market positioning.
Competitive Benchmarking: Prophylactic HIV Drugs Market
| Company | PrEP Portfolio | Patent Protection | Government Access | Geographic Coverage |
|---|---|---|---|---|
| Gilead Sciences | Very High | Very Strong | Very Strong | Global |
| ViiV Healthcare | High | Strong | Strong | Global |
| Merck & Co., Inc. | Medium | Strong | Strong | Global |
| Johnson & Johnson | Medium | Moderate | Moderate | Global |
| Cipla Limited | High | Low (Generic) | Very Strong | Emerging Markets |
| Mylan N.V. | High | Low (Generic) | Strong | Global |
| Teva Pharmaceutical | Medium | Low (Generic) | Moderate | Global |
| Hetero Healthcare | Medium | Low (Generic) | Strong | Emerging Markets |
Source: Future Market Insights competitive analysis, 2026.
Key Developments in Prophylactic HIV Drugs Market
- In 2025, ViiV Healthcare expanded access to Apretude® (cabotegravir long-acting injectable PrEP) by securing key reimbursement and regulatory milestones, including a positive NICE recommendation in England and Wales, while scaling manufacturing partnerships with MPP, Aurobindo, Cipla, and Viatris to improve availability across low- and middle-income countries in Sub-Saharan Africa.
- In 2025, Gilead Sciences advanced the PrEP market through the commercialization of lenacapavir (Yeztugo®), a twice-yearly injectable HIV prevention therapy that demonstrated very high efficacy in Phase 3 PURPOSE trials, offering a long-acting alternative to daily oral PrEP regimens.
Key Players in the Prophylactic HIV Drugs Market
Major Global Players
- Gilead Sciences
- ViiV Healthcare
- Merck & Co., Inc.
- Johnson & Johnson
- Cipla Limited
Emerging Players/Startups
- Mylan N.V.
- Teva Pharmaceutical Industries Ltd.
- Hetero Healthcare
- Aurobindo Pharma
- Lupin Limited
Report Scope and Coverage
| Parameter | Details |
|---|---|
| Quantitative Units | USD 36.78 billion to USD 57.12 billion, at a CAGR of 4.5% |
| Market Definition | The prophylactic HIV drugs market includes antiretroviral medications used for pre-exposure prophylaxis (PrEP), post-exposure prophylaxis (PEP), and maternal transmission prevention. Products include nucleoside reverse transcriptase inhibitors, integrase strand transfer inhibitors, and entry and fusion inhibitors in oral, injectable, and combination formulations. |
| Regions Covered | North America, Latin America, Europe, East Asia, South Asia and Pacific, Middle East and Africa |
| Countries Covered | China, India, Germany, Brazil, USA, UK, Japan, 30 plus countries |
| Key Companies Profiled | Gilead Sciences, ViiV Healthcare, Merck & Co., Inc., Johnson & Johnson, Cipla Limited, Mylan N.V., Teva Pharmaceutical Industries Ltd., Hetero Healthcare, Aurobindo Pharma Limited, Apotex Inc. |
| Forecast Period | 2026 to 2036 |
| Approach | Hybrid bottom-up and top-down methodology starting with verified transaction data, projecting adoption velocity across segments and regions. |
Market Segmentation Analysis
Prophylactic HIV Drugs Market Segmented by Product:
- Pre Exposure Prophylaxis
- Oral Tablets
- Daily Dose Regimens
- On Demand Regimens
- Injectable PrEP
- Long Acting Injectables
- Depot Formulations
- Oral Tablets
- Post Exposure Prophylaxis
- Emergency Oral Therapy
- Short Course Regimens
- Combination Therapy
- Hospital Based PEP
- Emergency Care Protocols
- Occupational Exposure Treatment
- Emergency Oral Therapy
- Combination Prophylactic Regimens
- Fixed Dose Combinations
- Multi Drug Tablets
- Enhanced Adherence Formulations
- Investigational Prophylaxis
- Pipeline Molecules
- Clinical Trial Drugs
- Fixed Dose Combinations
Prophylactic HIV Drugs Market Segmented by Drug Class:
- Nucleoside Reverse Transcriptase Inhibitors
- Tenofovir Based Regimens
- Tenofovir Disoproxil Fumarate
- Tenofovir Alafenamide
- Emtricitabine Based Regimens
- Combination Tablets
- Single Tablet Regimens
- Tenofovir Based Regimens
- Integrase Strand Transfer Inhibitors
- Dolutegravir Based Therapy
- Combination PrEP Regimens
- High Potency Inhibitors
- Raltegravir Based Therapy
- Short Term Prophylaxis
- Emergency Use Therapy
- Dolutegravir Based Therapy
- Entry And Fusion Inhibitors
- CCR5 Antagonists
- Maraviroc Based Therapy
- Investigational Molecules
- CCR5 Antagonists
Prophylactic HIV Drugs Market Segmented by Application:
- Pre Exposure Prophylaxis
- High Risk Individuals
- Sexual Exposure Prevention
- Partner Serodiscordant Cases
- Population Based Prevention
- Community Health Programs
- Public Health Initiatives
- High Risk Individuals
- Post Exposure Prophylaxis
- Occupational Exposure
- Healthcare Workers
- Needle Stick Injuries
- Non Occupational Exposure
- Emergency Prevention
- Sexual Assault Cases
- Occupational Exposure
- Maternal Prophylaxis
- Mother To Child Prevention
- Pregnancy Management
- Perinatal Prevention Programs
- Mother To Child Prevention
Prophylactic HIV Drugs Market Segmented by End Use:
- Hospitals
- Public Hospitals
- Government Healthcare Facilities
- Community Hospitals
- Private Hospitals
- Specialty Care Centers
- Multi Specialty Hospitals
- Public Hospitals
- Clinics
- Sexual Health Clinics
- HIV Treatment Clinics
- Outpatient Care Centers
- Sexual Health Clinics
- Non Governmental Organizations
- Public Health Organizations
- HIV Awareness Programs
- Community Outreach Programs
- Public Health Organizations
- Home Care Settings
- Self Administration
- Oral Therapy Users
- Long Acting Injection Users
- Self Administration
Prophylactic HIV Drugs Market Segmented by Distribution Channel:
- Hospital Pharmacies
- In Hospital Dispensing
- Emergency Care Supply
- Chronic Therapy Supply
- In Hospital Dispensing
- Retail Pharmacies
- Chain Pharmacies
- Urban Pharmacy Chains
- Independent Pharmacies
- Chain Pharmacies
- Online Pharmacies
- Digital Health Platforms
- Telemedicine Pharmacies
- E Prescription Services
- Digital Health Platforms
- Government Supply Programs
- Public Health Distribution
- Free Drug Programs
- Subsidized Drug Programs
- Public Health Distribution
Prophylactic HIV Drugs Market Segmented by Therapy Type:
- Continuous Therapy
- Daily Oral Prophylaxis
- Long Term Prevention
- Adherence Based Therapy
- Daily Oral Prophylaxis
- Long Acting Therapy
- Injectable Prevention
- Monthly Injections
- Quarterly Injections
- Injectable Prevention
- Emergency Therapy
- Post Exposure Regimens
- Short Term Treatment
- Immediate Response Therapy
- Post Exposure Regimens
Prophylactic HIV Drugs Market by Region:
- North America
- USA
- Canada
- Mexico
- Latin America
- Brazil
- Chile
- Rest of Latin America
- Western Europe
- Germany
- UK
- Italy
- Spain
- France
- Nordic
- BENELUX
- Rest of Western Europe
- Eastern Europe
- Russia
- Poland
- Hungary
- Balkan & Baltic
- Rest of Eastern Europe
- East Asia
- China
- Japan
- South Korea
- South Asia and Pacific
- India
- ASEAN
- Australia & New Zealand
- Rest of South Asia and Pacific
- Middle East & Africa
- Kingdom of Saudi Arabia
- Other GCC Countries
- Turkiye
- South Africa
- Other African Union
- Rest of Middle East & Africa
Research Sources and Bibliography
- 1. World Health Organization. (2025). WHO Guidelines on Pre-Exposure Prophylaxis for HIV Prevention. WHO.
- 2. USA Centers for Disease Control and Prevention. (2025). CDC PrEP Clinical Practice Guidelines. CDC.
- 3. UNAIDS. (2025). UNAIDS Global AIDS Update: Prevention Program Enrollment Data. UNAIDS.
- 4. European Medicines Agency. (2024). EMA Assessment Report: Long-Acting Injectable PrEP Formulations. EMA.
- 5. USA Food and Drug Administration. (2025). FDA Approved Drug Products: Antiretroviral Prophylactic Agents. FDA.
This bibliography is provided for reader reference. The full Future Market Insights report contains the complete reference list with publication dates, URLs, and supporting data for all cited works.
This Report Answers
- Estimating the size of the market and revenue projections from 2026 to 2036.
- Segmentation by product, drug class, application, end use, distribution channel, and therapy type.
- Insights about more than 30 country markets.
- Analysis of long-acting injectable PrEP transition and adherence improvements.
- Assessment of the competitive landscape and patent dynamics.
- Finding investment opportunities in government prevention programs and generic supply.
- Tracking PrEP program enrollment and regulatory developments across jurisdictions.
- Delivery of data in PDF and Excel formats.
Frequently Asked Questions
How big is the prophylactic hiv drugs market in 2026?
The global prophylactic hiv drugs market is estimated to be valued at USD 36.78 billion in 2026.
What will be the size of prophylactic hiv drugs market in 2036?
The market size for the prophylactic hiv drugs market is projected to reach USD 57.12 billion by 2036.
How much will be the prophylactic hiv drugs market growth between 2026 and 2036?
The prophylactic hiv drugs market is expected to grow at a 4.5% CAGR between 2026 and 2036.
What are the key product types in the prophylactic hiv drugs market?
The key product types in prophylactic hiv drugs market are pre exposure prophylaxis, post exposure prophylaxis and combination prophylactic regimens.
Which drug class segment is expected to contribute significant share in the prophylactic hiv drugs market in 2026?
In terms of drug class, nucleoside reverse transcriptase inhibitors segment is expected to command 50.0% share in the prophylactic hiv drugs market in 2026.
Preview the report firsthand - request a free sample
Get SampleGet the brochure for pricing and purchase details.
Get PDFTable of Content
- Executive Summary
- Global Market Outlook
- Demand-side Trends
- Supply-side Trends
- Technology Roadmap Analysis
- Analysis and Recommendations
- Market Overview
- Market Coverage / Taxonomy
- Market Definition / Scope / Limitations
- Research Methodology
- Chapter Orientation
- Analytical Lens and Working Hypotheses
- Market Structure, Signals, and Trend Drivers
- Benchmarking and Cross-market Comparability
- Market Sizing, Forecasting, and Opportunity Mapping
- Research Design and Evidence Framework
- Desk Research Programme (Secondary Evidence)
- Company Annual and Sustainability Reports
- Peer-reviewed Journals and Academic Literature
- Corporate Websites, Product Literature, and Technical Notes
- Earnings Decks and Investor Briefings
- Statutory Filings and Regulatory Disclosures
- Technical White Papers and Standards Notes
- Trade Journals, Industry Magazines, and Analyst Briefs
- Conference Proceedings, Webinars, and Seminar Materials
- Government Statistics Portals and Public Data Releases
- Press Releases and Reputable Media Coverage
- Specialist Newsletters and Curated Briefings
- Sector Databases and Reference Repositories
- FMI Internal Proprietary Databases and Historical Market Datasets
- Subscription Datasets and Paid Sources
- Social Channels, Communities, and Digital Listening Inputs
- Additional Desk Sources
- Expert Input and Fieldwork (Primary Evidence)
- Primary Modes
- Qualitative Interviews and Expert Elicitation
- Quantitative Surveys and Structured Data Capture
- Blended Approach
- Why Primary Evidence is Used
- Field Techniques
- Interviews
- Surveys
- Focus Groups
- Observational and In-context Research
- Social and Community Interactions
- Stakeholder Universe Engaged
- C-suite Leaders
- Board Members
- Presidents and Vice Presidents
- R&D and Innovation Heads
- Technical Specialists
- Domain Subject-matter Experts
- Scientists
- Physicians and Other Healthcare Professionals
- Governance, Ethics, and Data Stewardship
- Research Ethics
- Data Integrity and Handling
- Primary Modes
- Tooling, Models, and Reference Databases
- Desk Research Programme (Secondary Evidence)
- Data Engineering and Model Build
- Data Acquisition and Ingestion
- Cleaning, Normalisation, and Verification
- Synthesis, Triangulation, and Analysis
- Quality Assurance and Audit Trail
- Market Background
- Market Dynamics
- Drivers
- Restraints
- Opportunity
- Trends
- Scenario Forecast
- Demand in Optimistic Scenario
- Demand in Likely Scenario
- Demand in Conservative Scenario
- Opportunity Map Analysis
- Product Life Cycle Analysis
- Supply Chain Analysis
- Investment Feasibility Matrix
- Value Chain Analysis
- PESTLE and Porter’s Analysis
- Regulatory Landscape
- Regional Parent Market Outlook
- Production and Consumption Statistics
- Import and Export Statistics
- Market Dynamics
- Global Market Analysis 2021 to 2025 and Forecast, 2026 to 2036
- Historical Market Size Value (USD Million) Analysis, 2021 to 2025
- Current and Future Market Size Value (USD Million) Projections, 2026 to 2036
- Y-o-Y Growth Trend Analysis
- Absolute $ Opportunity Analysis
- Global Market Pricing Analysis 2021 to 2025 and Forecast 2026 to 2036
- Global Market Analysis 2021 to 2025 and Forecast 2026 to 2036, By Product
- Introduction / Key Findings
- Historical Market Size Value (USD Million) Analysis By Product , 2021 to 2025
- Current and Future Market Size Value (USD Million) Analysis and Forecast By Product , 2026 to 2036
- Pre Exposure Prophylaxis
- Oral Tablets
- Daily Dose Regimens
- On Demand Regimens
- Injectable PrEP
- Long Acting Injectables
- Depot Formulations
- Post Exposure Prophylaxis
- Emergency Oral Therapy
- Short Course Regimens
- Combination Therapy
- Hospital Based PEP
- Emergency Care Protocols
- Combination Prophylactic Regimens
- Fixed Dose Combinations
- Multi Drug Tablets
- Enhanced Adherence Formulations
- Investigational Prophylaxis
- Pipeline Molecules
- Pre Exposure Prophylaxis
- Y-o-Y Growth Trend Analysis By Product , 2021 to 2025
- Absolute $ Opportunity Analysis By Product , 2026 to 2036
- Global Market Analysis 2021 to 2025 and Forecast 2026 to 2036, By Drug Class
- Introduction / Key Findings
- Historical Market Size Value (USD Million) Analysis By Drug Class, 2021 to 2025
- Current and Future Market Size Value (USD Million) Analysis and Forecast By Drug Class, 2026 to 2036
- Nucleoside Reverse Transcriptase Inhibitors
- Tenofovir Based Regimens
- Tenofovir Disoproxil Fumarate
- Tenofovir Alafenamide
- Emtricitabine Based Regimens
- Combination Tablets
- Single Tablet Regimens
- Integrase Strand Transfer Inhibitors
- Dolutegravir Based Therapy
- Combination PrEP Regimens
- High Potency Inhibitors
- Raltegravir Based Therapy
- Short Term Prophylaxis
- Entry And Fusion Inhibitors
- CCR5 Antagonists
- Maraviroc Based Therapy
- Investigational Molecules
- Nucleoside Reverse Transcriptase Inhibitors
- Y-o-Y Growth Trend Analysis By Drug Class, 2021 to 2025
- Absolute $ Opportunity Analysis By Drug Class, 2026 to 2036
- Global Market Analysis 2021 to 2025 and Forecast 2026 to 2036, By Application
- Introduction / Key Findings
- Historical Market Size Value (USD Million) Analysis By Application, 2021 to 2025
- Current and Future Market Size Value (USD Million) Analysis and Forecast By Application, 2026 to 2036
- Pre Exposure Prophylaxis
- High Risk Individuals
- Sexual Exposure Prevention
- Partner Serodiscordant Cases
- Population Based Prevention
- Community Health Programs
- Public Health Initiatives
- Post Exposure Prophylaxis
- Occupational Exposure
- Healthcare Workers
- Needle Stick Injuries
- Non Occupational Exposure
- Emergency Prevention
- Maternal Prophylaxis
- Mother To Child Prevention
- Pregnancy Management
- Perinatal Prevention Programs
- Pre Exposure Prophylaxis
- Y-o-Y Growth Trend Analysis By Application, 2021 to 2025
- Absolute $ Opportunity Analysis By Application, 2026 to 2036
- Global Market Analysis 2021 to 2025 and Forecast 2026 to 2036, By End Use
- Introduction / Key Findings
- Historical Market Size Value (USD Million) Analysis By End Use, 2021 to 2025
- Current and Future Market Size Value (USD Million) Analysis and Forecast By End Use, 2026 to 2036
- Hospitals
- Public Hospitals
- Government Healthcare Facilities
- Community Hospitals
- Private Hospitals
- Specialty Care Centers
- Multi Specialty Hospitals
- Clinics
- Sexual Health Clinics
- HIV Treatment Clinics
- Outpatient Care Centers
- Non Governmental Organizations
- Public Health Organizations
- HIV Awareness Programs
- Community Outreach Programs
- Home Care Settings
- Self Administration
- Oral Therapy Users
- Long Acting Injection Users
- Hospitals
- Y-o-Y Growth Trend Analysis By End Use, 2021 to 2025
- Absolute $ Opportunity Analysis By End Use, 2026 to 2036
- Global Market Analysis 2021 to 2025 and Forecast 2026 to 2036, By Distribution Channel
- Introduction / Key Findings
- Historical Market Size Value (USD Million) Analysis By Distribution Channel, 2021 to 2025
- Current and Future Market Size Value (USD Million) Analysis and Forecast By Distribution Channel, 2026 to 2036
- Hospital Pharmacies
- In Hospital Dispensing
- Emergency Care Supply
- Chronic Therapy Supply
- Retail Pharmacies
- Chain Pharmacies
- Urban Pharmacy Chains
- Independent Pharmacies
- Online Pharmacies
- Digital Health Platforms
- Telemedicine Pharmacies
- E Prescription Services
- Government Supply Programs
- Public Health Distribution
- Free Drug Programs
- Subsidized Drug Programs
- Hospital Pharmacies
- Y-o-Y Growth Trend Analysis By Distribution Channel, 2021 to 2025
- Absolute $ Opportunity Analysis By Distribution Channel, 2026 to 2036
- Global Market Analysis 2021 to 2025 and Forecast 2026 to 2036, By Therapy Type
- Introduction / Key Findings
- Historical Market Size Value (USD Million) Analysis By Therapy Type, 2021 to 2025
- Current and Future Market Size Value (USD Million) Analysis and Forecast By Therapy Type, 2026 to 2036
- Continuous Therapy
- Daily Oral Prophylaxis
- Long Term Prevention
- Adherence Based Therapy
- Long Acting Therapy
- Injectable Prevention
- Monthly Injections
- Quarterly Injections
- Emergency Therapy
- Post Exposure Regimens
- Short Term Treatment
- Immediate Response Therapy
- Continuous Therapy
- Y-o-Y Growth Trend Analysis By Therapy Type, 2021 to 2025
- Absolute $ Opportunity Analysis By Therapy Type, 2026 to 2036
- Global Market Analysis 2021 to 2025 and Forecast 2026 to 2036, By Region
- Introduction
- Historical Market Size Value (USD Million) Analysis By Region, 2021 to 2025
- Current Market Size Value (USD Million) Analysis and Forecast By Region, 2026 to 2036
- North America
- Latin America
- Western Europe
- Eastern Europe
- East Asia
- South Asia and Pacific
- Middle East & Africa
- Market Attractiveness Analysis By Region
- North America Market Analysis 2021 to 2025 and Forecast 2026 to 2036, By Country
- Historical Market Size Value (USD Million) Trend Analysis By Market Taxonomy, 2021 to 2025
- Market Size Value (USD Million) Forecast By Market Taxonomy, 2026 to 2036
- By Country
- USA
- Canada
- Mexico
- By Product
- By Drug Class
- By Application
- By End Use
- By Distribution Channel
- By Therapy Type
- By Country
- Market Attractiveness Analysis
- By Country
- By Product
- By Drug Class
- By Application
- By End Use
- By Distribution Channel
- By Therapy Type
- Key Takeaways
- Latin America Market Analysis 2021 to 2025 and Forecast 2026 to 2036, By Country
- Historical Market Size Value (USD Million) Trend Analysis By Market Taxonomy, 2021 to 2025
- Market Size Value (USD Million) Forecast By Market Taxonomy, 2026 to 2036
- By Country
- Brazil
- Chile
- Rest of Latin America
- By Product
- By Drug Class
- By Application
- By End Use
- By Distribution Channel
- By Therapy Type
- By Country
- Market Attractiveness Analysis
- By Country
- By Product
- By Drug Class
- By Application
- By End Use
- By Distribution Channel
- By Therapy Type
- Key Takeaways
- Western Europe Market Analysis 2021 to 2025 and Forecast 2026 to 2036, By Country
- Historical Market Size Value (USD Million) Trend Analysis By Market Taxonomy, 2021 to 2025
- Market Size Value (USD Million) Forecast By Market Taxonomy, 2026 to 2036
- By Country
- Germany
- UK
- Italy
- Spain
- France
- Nordic
- BENELUX
- Rest of Western Europe
- By Product
- By Drug Class
- By Application
- By End Use
- By Distribution Channel
- By Therapy Type
- By Country
- Market Attractiveness Analysis
- By Country
- By Product
- By Drug Class
- By Application
- By End Use
- By Distribution Channel
- By Therapy Type
- Key Takeaways
- Eastern Europe Market Analysis 2021 to 2025 and Forecast 2026 to 2036, By Country
- Historical Market Size Value (USD Million) Trend Analysis By Market Taxonomy, 2021 to 2025
- Market Size Value (USD Million) Forecast By Market Taxonomy, 2026 to 2036
- By Country
- Russia
- Poland
- Hungary
- Balkan & Baltic
- Rest of Eastern Europe
- By Product
- By Drug Class
- By Application
- By End Use
- By Distribution Channel
- By Therapy Type
- By Country
- Market Attractiveness Analysis
- By Country
- By Product
- By Drug Class
- By Application
- By End Use
- By Distribution Channel
- By Therapy Type
- Key Takeaways
- East Asia Market Analysis 2021 to 2025 and Forecast 2026 to 2036, By Country
- Historical Market Size Value (USD Million) Trend Analysis By Market Taxonomy, 2021 to 2025
- Market Size Value (USD Million) Forecast By Market Taxonomy, 2026 to 2036
- By Country
- China
- Japan
- South Korea
- By Product
- By Drug Class
- By Application
- By End Use
- By Distribution Channel
- By Therapy Type
- By Country
- Market Attractiveness Analysis
- By Country
- By Product
- By Drug Class
- By Application
- By End Use
- By Distribution Channel
- By Therapy Type
- Key Takeaways
- South Asia and Pacific Market Analysis 2021 to 2025 and Forecast 2026 to 2036, By Country
- Historical Market Size Value (USD Million) Trend Analysis By Market Taxonomy, 2021 to 2025
- Market Size Value (USD Million) Forecast By Market Taxonomy, 2026 to 2036
- By Country
- India
- ASEAN
- Australia & New Zealand
- Rest of South Asia and Pacific
- By Product
- By Drug Class
- By Application
- By End Use
- By Distribution Channel
- By Therapy Type
- By Country
- Market Attractiveness Analysis
- By Country
- By Product
- By Drug Class
- By Application
- By End Use
- By Distribution Channel
- By Therapy Type
- Key Takeaways
- Middle East & Africa Market Analysis 2021 to 2025 and Forecast 2026 to 2036, By Country
- Historical Market Size Value (USD Million) Trend Analysis By Market Taxonomy, 2021 to 2025
- Market Size Value (USD Million) Forecast By Market Taxonomy, 2026 to 2036
- By Country
- Kingdom of Saudi Arabia
- Other GCC Countries
- Turkiye
- South Africa
- Other African Union
- Rest of Middle East & Africa
- By Product
- By Drug Class
- By Application
- By End Use
- By Distribution Channel
- By Therapy Type
- By Country
- Market Attractiveness Analysis
- By Country
- By Product
- By Drug Class
- By Application
- By End Use
- By Distribution Channel
- By Therapy Type
- Key Takeaways
- Key Countries Market Analysis
- USA
- Pricing Analysis
- Market Share Analysis, 2025
- By Product
- By Drug Class
- By Application
- By End Use
- By Distribution Channel
- By Therapy Type
- Canada
- Pricing Analysis
- Market Share Analysis, 2025
- By Product
- By Drug Class
- By Application
- By End Use
- By Distribution Channel
- By Therapy Type
- Mexico
- Pricing Analysis
- Market Share Analysis, 2025
- By Product
- By Drug Class
- By Application
- By End Use
- By Distribution Channel
- By Therapy Type
- Brazil
- Pricing Analysis
- Market Share Analysis, 2025
- By Product
- By Drug Class
- By Application
- By End Use
- By Distribution Channel
- By Therapy Type
- Chile
- Pricing Analysis
- Market Share Analysis, 2025
- By Product
- By Drug Class
- By Application
- By End Use
- By Distribution Channel
- By Therapy Type
- Germany
- Pricing Analysis
- Market Share Analysis, 2025
- By Product
- By Drug Class
- By Application
- By End Use
- By Distribution Channel
- By Therapy Type
- UK
- Pricing Analysis
- Market Share Analysis, 2025
- By Product
- By Drug Class
- By Application
- By End Use
- By Distribution Channel
- By Therapy Type
- Italy
- Pricing Analysis
- Market Share Analysis, 2025
- By Product
- By Drug Class
- By Application
- By End Use
- By Distribution Channel
- By Therapy Type
- Spain
- Pricing Analysis
- Market Share Analysis, 2025
- By Product
- By Drug Class
- By Application
- By End Use
- By Distribution Channel
- By Therapy Type
- France
- Pricing Analysis
- Market Share Analysis, 2025
- By Product
- By Drug Class
- By Application
- By End Use
- By Distribution Channel
- By Therapy Type
- India
- Pricing Analysis
- Market Share Analysis, 2025
- By Product
- By Drug Class
- By Application
- By End Use
- By Distribution Channel
- By Therapy Type
- ASEAN
- Pricing Analysis
- Market Share Analysis, 2025
- By Product
- By Drug Class
- By Application
- By End Use
- By Distribution Channel
- By Therapy Type
- Australia & New Zealand
- Pricing Analysis
- Market Share Analysis, 2025
- By Product
- By Drug Class
- By Application
- By End Use
- By Distribution Channel
- By Therapy Type
- China
- Pricing Analysis
- Market Share Analysis, 2025
- By Product
- By Drug Class
- By Application
- By End Use
- By Distribution Channel
- By Therapy Type
- Japan
- Pricing Analysis
- Market Share Analysis, 2025
- By Product
- By Drug Class
- By Application
- By End Use
- By Distribution Channel
- By Therapy Type
- South Korea
- Pricing Analysis
- Market Share Analysis, 2025
- By Product
- By Drug Class
- By Application
- By End Use
- By Distribution Channel
- By Therapy Type
- Russia
- Pricing Analysis
- Market Share Analysis, 2025
- By Product
- By Drug Class
- By Application
- By End Use
- By Distribution Channel
- By Therapy Type
- Poland
- Pricing Analysis
- Market Share Analysis, 2025
- By Product
- By Drug Class
- By Application
- By End Use
- By Distribution Channel
- By Therapy Type
- Hungary
- Pricing Analysis
- Market Share Analysis, 2025
- By Product
- By Drug Class
- By Application
- By End Use
- By Distribution Channel
- By Therapy Type
- Kingdom of Saudi Arabia
- Pricing Analysis
- Market Share Analysis, 2025
- By Product
- By Drug Class
- By Application
- By End Use
- By Distribution Channel
- By Therapy Type
- Turkiye
- Pricing Analysis
- Market Share Analysis, 2025
- By Product
- By Drug Class
- By Application
- By End Use
- By Distribution Channel
- By Therapy Type
- South Africa
- Pricing Analysis
- Market Share Analysis, 2025
- By Product
- By Drug Class
- By Application
- By End Use
- By Distribution Channel
- By Therapy Type
- USA
- Market Structure Analysis
- Competition Dashboard
- Competition Benchmarking
- Market Share Analysis of Top Players
- By Regional
- By Product
- By Drug Class
- By Application
- By End Use
- By Distribution Channel
- By Therapy Type
- Competition Analysis
- Competition Deep Dive
- Gilead Sciences
- Overview
- Product Portfolio
- Profitability by Market Segments (Product/Age /Sales Channel/Region)
- Sales Footprint
- Strategy Overview
- Marketing Strategy
- Product Strategy
- Channel Strategy
- ViiV Healthcare
- Merck & Co., Inc.
- Johnson & Johnson
- Cipla Limited
- Mylan N.V.
- Teva Pharmaceutical Industries Ltd.
- Hetero Healthcare
- Aurobindo Pharma Limited
- Apotex Inc.
- Gilead Sciences
- Competition Deep Dive
- Assumptions & Acronyms Used


